News:
- Big Data falls off the hype cycle: http://www.datasciencecentral.com/profiles/blogs/big-data-falls-off-the-hype-cycle
- Tableau 10 in beta:
Fireworks!
NOTE: Overall, statistics are hard to follow across sites and even different reports from the same groups.
2015 Consumption Statistics:
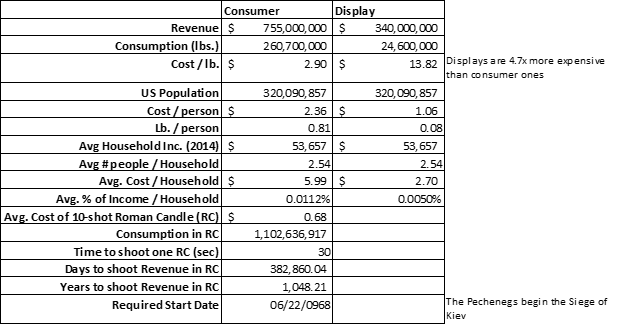
- Consumption: 260.7 Million lbs. (Consumer), 24.6 million lbs. (Display) (#5 APA)
- *** The consumer weight of fireworks used is roughly equivalent to the weight of the entire population of Hawaii! ***
- Revenue: $755 million (Consumer), $340 million (Display) (#5 APA). Focusing on the consumer spending:
- This is over 100x more than the revenue Katy Perry would have generated with the 7 million U.S. sales of her song “Firework” on iTunes.
- This is more than the all the money we spent at In ‘N Out Burger in 2015.
- If one person spent the same amount on Roman Candles, it would take them over 1,000 years to use the amount of fireworks we purchase in a year.
.png)
Are fireworks Dangerous?
- 67% of fireworks injuries occur around July 4th
- Injuries by Age: This graph makes it seem like young adults are most commonly injured, but when you look at 20 year bands, it breaks down differently:
- 0-19 = 47%
- 5-24 = 49%
- 10-24 (smaller than 20yr band) = 32%
- 25-44 = 34%
- 12,000 fireworks injuries (CPSC) out of 31 million injuries = .04% of injuries are fireworks (#7 APA)
- 11 Deaths (#9 CPSC)
– #8 APA
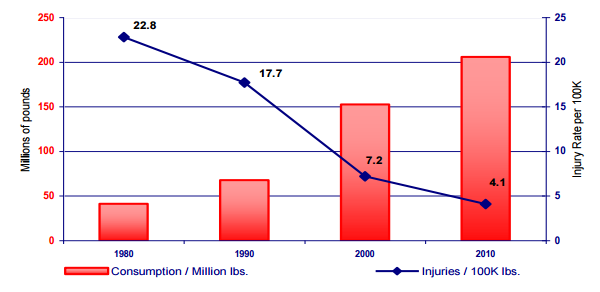
- Usage is growing but injuries are falling according to the American Pyrotechnics Association
- Injuries are falling while consumption goes up. Injuries are also falling as our population has increased. However, in absolute terms injuries are relatively constant
- APA also contends that fireworks injuries are a small minority of total injuries to kids
– #10 APA
Only three states (DE, MA, NJ) ban fireworks (#8 APA)
Links:
- Consumer Products Safety Commission (CPSC) Fireworks Infographic – http://www.cpsc.gov/PageFiles/150398/Fireworks-Infographic-2015-web.pdf?epslanguage=en
- National Fire Protection Agency – http://www.nfpa.org/public-education/by-topic/outdoors-and-seasonal/fireworks/reports-and-statistics-about-fireworks
- Washington State Patrol – http://www.wsp.wa.gov/fire/statistics.htm
- Statistics Brain (Various Sources) – http://www.statisticbrain.com/firework-statistics/
- American Pyrotechincs Association – http://www.americanpyro.com/industry-facts-figures
- 2015 US Population – http://www.usnews.com/opinion/blogs/robert-schlesinger/2014/12/31/us-population-2015-320-million-and-world-population-72-billion
- Fireworks injuries in perspective – http://www.americanpyro.com/assets/docs/FactsandFigures/fireworks%20injuries%20perspecitive.2016.pdf
- Fireworks liberalization- http://www.americanpyro.com/assets/docs/FactsandFigures/consumpvinjuriesliberalizationgraph%201980-2010.pdf
- CPSC 2014 Fireworks Report – http://www.cpsc.gov/en/Media/Documents/Research–Statistics/Injury-Statistics/Fuel-Lighters-and-Fireworks/2014-Fireworks-Annual-Report/?utm_source=rss&utm_medium=rss&utm_campaign=Fuel%2c+Lighters+and+Fireworks+Injury+Statistics
- APA Injuries to Children – http://www.americanpyro.com/assets/docs/FactsandFigures/injuries%20to%20children%20ages%205-18%202016.pdf
- US Income – http://www.deptofnumbers.com/income/us/
- NFPA Fireworks Info Sheet – http://www.nfpa.org/~/media/files/research/fact-sheets/fireworksfactsheet.pdf?la=en
- APA Fireworks Injures vs. Consumption – http://www.americanpyro.com/assets/docs/FactsandFigures/fireworks%20related%20injuries%20rtable%201976%20-2015.pdf
- Katy Perry Firework Wikipedia – https://en.wikipedia.org/wiki/Firework_(song)
- In ‘N Out Burger Sales – http://nrn.com/top-100/2015-top-100-restaurant-chain-countdown#slide-43-field_images-136081
Podcast: Play in new window | Download


.png)

.png)

.png)

.png)